
Cancer is a diagnosis with dramatic impact on one's life, raising fundamental questions about the future. Part of this future is in most cases a therapy that aims at removing or at least limiting the growth of the tumor. This step requires in-depth knowledge about the biological characteristics of the tumor, which is why commonly a sample is taken and investigated under the microscope. This investigation, performed by a trained pathologist, is what we call the gold standard - i.e., the best possible method for diagnosis and prognostication.
One of the things the pathologist will investigate, typically at high (400X) magnification, is the number of mitotic figures (i.e., cells undergoing division). This is how mitotic figures look like (green circles):

More cell division activity is correlated with tumor growth and also spread. Guidelines recommend to estimate the density of mitotic figures in regions of high activity, following the assumption that this is the most relevant region to predict the behavior of the tumor. This is an ill-posed problem: The pathologist needs a high magnification to identify those special cells, however, with high magnification he/she only sees a very limited part of the microscopy slide and thus can't do an estimation of the complete slide.
How we can use artificial intelligence to do better
For this problem, machine learning can provide a solution: If we can detect these cells in the complete microscopy slide, we can do computerized calculations of density and thus preselect an area which we can assume is of highest prognostic relevance. In the field of veterinary pathology, we have already shown that this works really well [1].
Yet, our work largely depended on the availability of large-scale data sets. Why does it need to be large-scale? Because biological variability leads to image variability, and we need our algorithms to cover for that. In fact, detection performance scales significantly with dataset size [2]. This is especially true for regions of the image where the quality is less than perfect: if we exclude this from the training data of our AI solutions, then they will be not really robust. This means that, in the end, it is good to annotate complete microscopy slides, and not only parts thereof. This is also the only way we can show that the AI solution works in a real setting, just digitizing the image and letting the algorithm do its magic.
Only relevant for veterinary pathology?
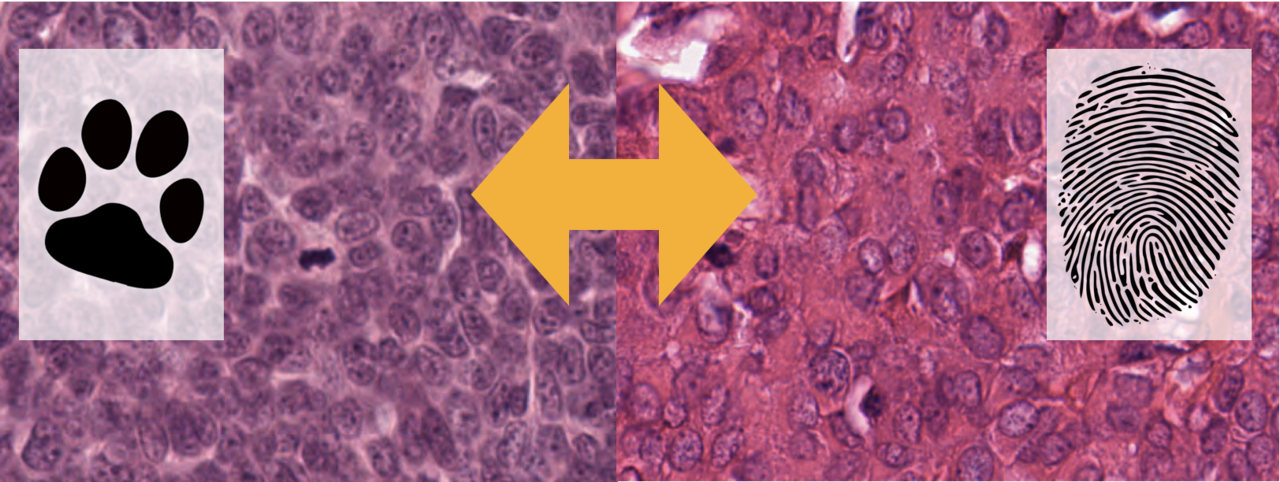
We were dealing with a dog tumor all the time. And, while I can't tell a difference between animal tissue and human tissue, the most often heard criticism we had to face in peer review is: Nice work, but it's not human tissue, and thus might be out of scope for the journal/conference. Frankly, that was disappointing at times.
So we set out to show that, in fact, it's not all that different. In our most recent publication [3], we established a data set of dog breast cancer. Yes, dogs also suffer from breast cancer, just as humans do. On this large data set (actually, by far the largest from breast cancer), we were able to show that we can do mitotic figure detection on level of an expert pathologist with our algorithms. This only worked this well, because our data set was large.
To investigate inter-species robustness, we applied the same system that we built using our dog tissue data set on the popular AMIDA13 data set (which is a human mitotic figure data set). AMIDA13 is part of the popular TUPAC16 data set, and was acquired using a very similar microscopy slide digitization pipeline. Those devices, also called whole slide image scanners, have a distinctive color representation, and we just wanted to be sure to rule out this influence.
The performance we achieved there was okay, but not really great (F1-score of up to 0.628). Compared to the F1-Score of 0.79 on our own data set, this was a bit of a disappointment.
Is it really an inter-species difference?
We asked ourselves: Why is that? Is it because of the inter-species gap? Is it, because the slides that were digitized were just prepared differently? Or is it just because the annotation data was somewhat different?
Luckily, we just did a re-annotation of the TUPAC16 data set (including the AMIDA13) by our own expert and methods [4], which led us to believe that some mitotic figures might have been missed by the initial experts, which, of course, limits the performance (it's also what we compare against to assess the performance).
When we compared against this new set of annotations on the same AMIDA13 image set, we found that the performance was already much better (F1 up to 0.696).
So, what does it all mean in the end?
Differences between data sets can cause systems built using only one of these data sets to degrade on others. This domain shift is currently a big issue in microscopy image analysis. While the use of different scanners is clearly a big issue in this, species itself seems to play a much smaller role.
Consistency of image annotations - and reproducibility thereof by different experts is however a big thing. In the world of pathology, we have to always be mindful that a lot of what we expect to be true ist just human made and can be seen differently by another expert. This is a major factor limiting the development of AI solutions.
Why you should download the data set
Are you a machine learning developer working on mitosis detection? Then you should have a look at our data set. It is the only one that provides annotations for the complete microscopy slide, and it allows you to refine your methods in this realistic setting.
You can also use it jointly with other data sets to make them more robust on the complete slide, including all those regions where the tissue quality is less than perfect.
We are curious about what you will be able to show with it.
[1] https://www.nature.com/articles/s41598-020-73246-2
[2] https://www.nature.com/articles/s41597-019-0290-4
[3] https://www.nature.com/articles/s41597-020-00756-z
[4] https://arxiv.org/pdf/2007.05351.pdf


Please sign in or register for FREE
If you are a registered user on Research Communities by Springer Nature, please sign in