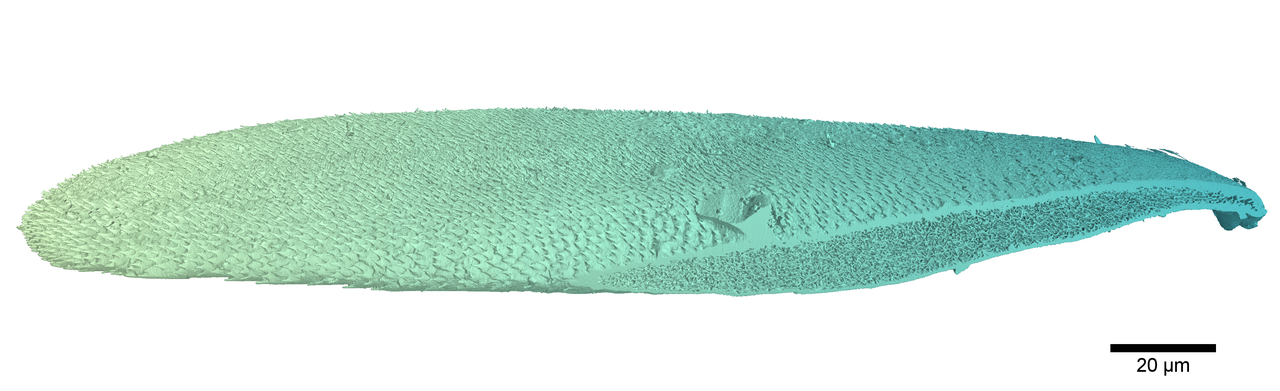
The white scales of the Lepidiota stigma and Cyphochilus beetles (Figure 1) have fascinated scientists for over a decade, principally due to the strange internal nanostructure of the scales, which is the source of their amazing optical properties. I came to study these scales during my PhD at the University of Sheffield and as a part of a larger collaboration aimed at using the properties of these scales to design a new generation of bio-inspired sustainable white paint. This was alongside AkzoNobel and the Natural History Museum.

Throughout the first year of my PhD I tried various methods to determine key physical properties of the scale's internal structure with very limited success. Most characterisation methods required the scales to be cut open, which to me raised concerns over whether the structure I was seeing was representative of an undamaged scale. It became clear that the only way to get the information I needed was to do X-ray nano-tomography on intact scales. This meant writing a proposal to the European Synchrotron Radiation Facility (ESRF), where I was granted time to use the beamline ID16B, a machine capable of scanning whole scales with a pixel resolution of 25 nm.
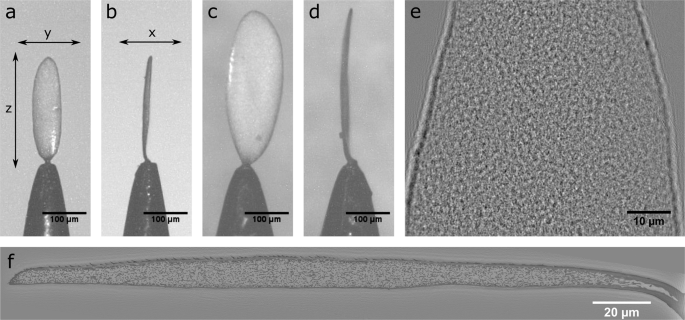
With hindsight I can safely say I had no idea what I was letting myself in for with this experiment. On paper it sounded so simple, scan a complete beetle scale using multiple overlapping tomography scans and put the whole thing together in silico to make a complete 3-D dataset encompassing the intact internal structure in its entirety. Easy right? The first dose of reality came with the sample mounting. As I stubbornly wanted to scan a complete scale along a single axis, as opposed to just a small section, the scale had to be mounted perfectly straight on the tip of a needle. Now mounting anything nice and straight on the tip of a needle is not a straightforward task, but a scale less than 120 µm wide? Well that took 2 months of practice before I finally managed it (Figure 2).

With the samples mounted and all of the tomography scans collected at the ESRF, it all seemed to be coming together, but I was completely unprepared for what came next. The tomography raw data that took just 3 days to collect would go on to take over a year to reach its final reconstructed state. The internal structure of the scales is amorphous and therefore the standard image processing routines for the alignment of the individual x-ray projection images proved unreliable. As a result, I had to align all of the images from different projection distances by eye. This process took more than two hours per scan even with a Python code which automated all the clicking between images.
With the images aligned and the tomography assembled, I was still not out of the woods, as the assembled scale matrices for the Lepidiota stigma and Cyphochilus beetles were ~40 GB and 25 GB respectively. Now I had a computing problem. To process the data I needed huge amounts of memory to filter and threshold the data, far beyond what any single computer is capable of. I was saved by the Sheffield Advanced Research Computer (ShARC), which boasts nodes with >256 GB of memory and the invaluable help of Will Furance, a Research Software Engineer at the University of Sheffield. Even then, certain aspects of the image processing routines had to be carefully broken down and parallelised in order to bring the processing time down from months to weeks.
Overall, the final matrices, one for a Lepidiota stigma scale and one for a Cyphochilus scale, represent the defining dataset of my PhD and a workload I am pleased no one else will have to go through again! Finally, I am so excited to have this data widely available to the scientific community, not only because it showcases the amazing possibilities for generating large area maps via overlapping high resolution tomography scans, but because I think the data will be incredibly useful to a wide range of scientific research, especially for designing new and advanced optical materials and devices.

Please sign in or register for FREE
If you are a registered user on Research Communities by Springer Nature, please sign in